

When national property price indices show flat or marginally negative figures, the instinct might be to apply uniform valuation approaches across all markets. However, in 2026, this assumption could lead to significant valuation errors. Valuation Methodology for Flat Headline Prices: Surveyor Techniques When Market Momentum Masks Regional Divergence has become essential knowledge for property professionals navigating a market where headline stability conceals dramatic regional variations—from London's -40% net balance to Scotland's continuing growth trajectory.
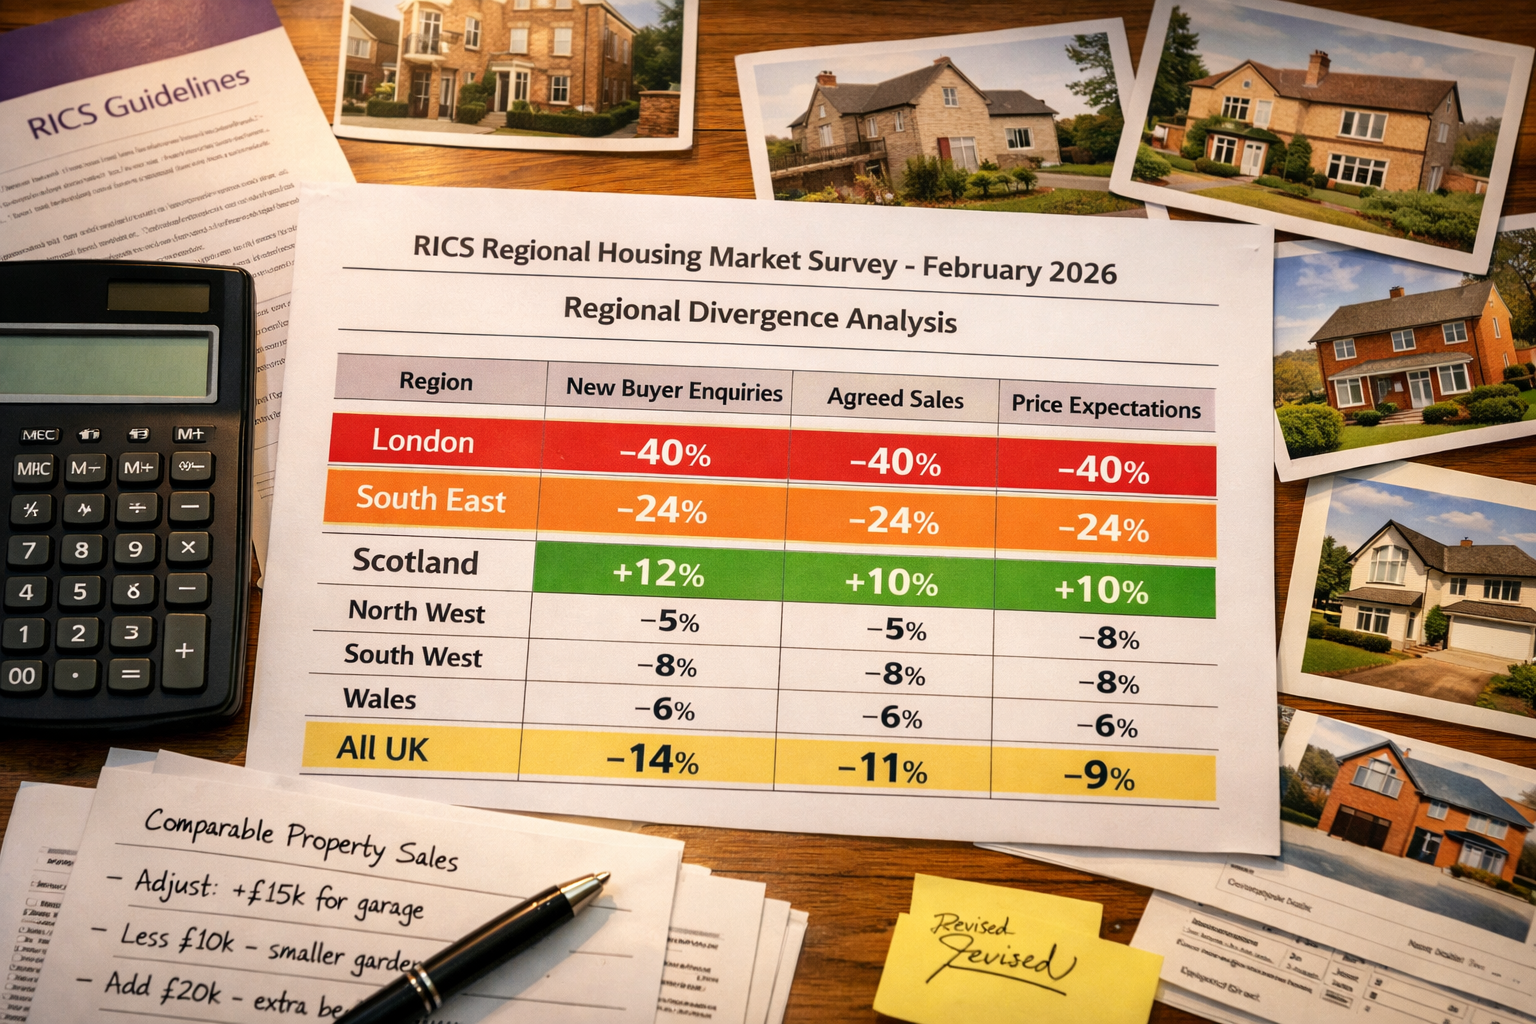
The February 2026 RICS UK Residential Market Survey revealed a deceptively simple headline: prices remained broadly flat with a net balance of -12%[3]. Yet beneath this surface calm lies profound geographic divergence that demands sophisticated surveyor techniques. Understanding how to adjust valuations accurately when regional markets move in opposite directions separates competent surveyors from exceptional ones.

Key Takeaways
- Regional divergence has reached historic levels in 2026, with London experiencing -40% net balance while Scotland and Northern Ireland show positive growth, requiring location-specific valuation adjustments
- Flat headline prices mask critical market variations that demand surveyors employ differentiated methodologies rather than relying on national comparable evidence
- Comparable selection and adjustment techniques must incorporate regional market sentiment data, forward-looking indicators, and localized transaction patterns to maintain valuation accuracy
- London's sentiment collapse from +56% to +7% in twelve-month expectations represents the most dramatic shift, requiring immediate recalibration of valuation assumptions for capital properties
- Northern markets demonstrate resilience that creates opportunities for more confident valuations, though momentum moderation requires careful monitoring
Understanding the 2026 Market Context: When Headlines Deceive
The Valuation Methodology for Flat Headline Prices: Surveyor Techniques When Market Momentum Masks Regional Divergence begins with recognizing what flat headline figures actually represent. February 2026 data shows a national net balance of -12%, representing a slight decline from -10% the previous month[3]. For surveyors accustomed to using national indices as baseline references, this suggests a straightforward flat-to-declining market.
However, this interpretation fundamentally misrepresents market reality. 📊
The Geographic Divide
London experiences the most acute downward pressure with a net balance of -40%—more than three times the national average[3]. This concentration of valuation challenges in the capital creates immediate implications for surveyors working across the Greater London area, from Chelsea property valuations to outer boroughs like Bexley.
Meanwhile, the South East shows substantial price declines with a net balance of -24%, and East Anglia records -26%[3], placing these regions among the weakest performers nationally. The southern England property market—historically the engine of UK price growth—now represents the primary source of downward pressure.
Contrast this with Northern Ireland and Scotland, which continue experiencing rising prices[3], providing a geographic counterpoint that demonstrates the inadequacy of national headline figures for local valuation work. The North West prices edge higher, though momentum has moderated from +43% in the previous month[3], indicating stabilization rather than sustained growth.
The Sentiment Shift
Perhaps most striking is London's twelve-month expectations collapse to +7% from +56% in the previous survey period[3]—a dramatic 49-point sentiment reversal representing the most significant indicator of changing valuation outlook in major markets. This forward-looking data provides critical context that backward-looking comparable evidence alone cannot capture.
When conducting RICS property valuations, surveyors must now integrate this sentiment data into their methodology, recognizing that buyer demand is declining amid interest rate concerns[3], creating valuation pressures particularly acute in capital appreciation-sensitive markets[1].
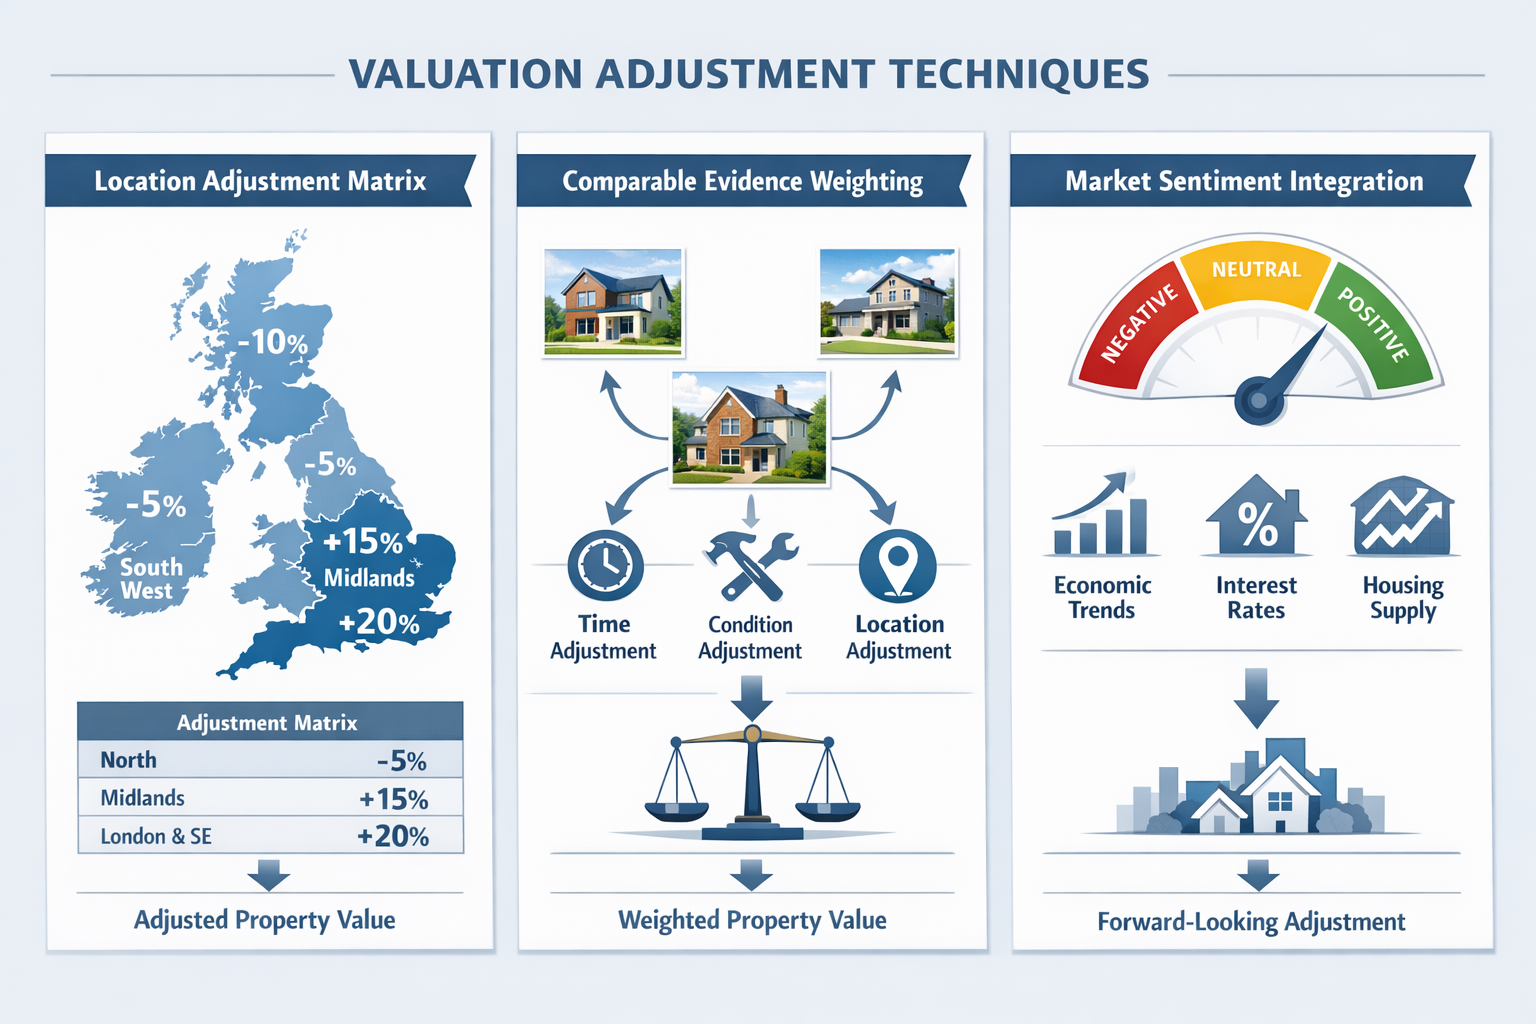
Core Valuation Techniques for Regionally Divergent Markets
The Valuation Methodology for Flat Headline Prices: Surveyor Techniques When Market Momentum Masks Regional Divergence requires surveyors to abandon one-size-fits-all approaches and implement region-specific techniques that account for local market dynamics.
Technique 1: Localized Comparable Selection with Regional Weighting
Traditional comparable evidence selection focuses on physical property characteristics—size, condition, location amenity. In divergent markets, surveyors must add an additional layer: regional market momentum weighting.
For London and South East properties:
- Prioritize the most recent comparables (within 3 months maximum)
- Apply downward time adjustments even for recent sales
- Weight sentiment indicators heavily in final valuation conclusions
- Consider forward-looking market expectations in valuation ranges
For Scotland and Northern Ireland properties:
- Extend comparable timeframe to 6 months with confidence
- Apply modest upward time adjustments for older comparables
- Weight positive momentum in valuation positioning
- Consider supply constraints that support continued growth
For transitioning markets (North West, Yorkshire):
- Use mixed comparable timeframes to capture momentum shifts
- Apply variable time adjustments based on sub-market analysis
- Monitor sentiment changes month-to-month for adjustment calibration
This differentiated approach recognizes that a six-month-old comparable in a -40% net balance market (London) carries fundamentally different weight than the same age comparable in a positive growth market (Scotland)[2].
Technique 2: Sentiment-Adjusted Valuation Ranges
Rather than providing point valuations in divergent markets, professional surveyors should employ sentiment-adjusted valuation ranges that reflect market uncertainty and directional momentum.
The formula incorporates three components:
- Base comparable value (traditional comparable analysis)
- Regional sentiment adjustment (derived from RICS net balance data)
- Forward expectation modifier (based on twelve-month outlook)
For a London property where comparables suggest £750,000:
- Base value: £750,000
- Regional sentiment adjustment (-40% net balance): -3% to -5%
- Forward expectation modifier (+7% vs. +56% previous): additional -2%
- Adjusted valuation range: £697,500 – £712,500
For a Scotland property where comparables suggest £250,000:
- Base value: £250,000
- Regional sentiment adjustment (positive net balance): +2% to +4%
- Forward expectation modifier (sustained positive outlook): additional +1%
- Adjusted valuation range: £257,500 – £262,500
This methodology provides clients with realistic expectations while maintaining professional standards. When working with local surveyors across different regions, understanding these regional adjustments becomes critical for accurate valuations.
Technique 3: Transaction Volume Analysis
New instruction supply remains stable with a net balance of +2%[3], indicating a broadly consistent flow of fresh listings. However, this national stability masks regional variations in transaction volumes that affect comparable reliability.
Surveyors should:
✅ Assess local transaction density before selecting comparables
✅ Apply reliability weighting based on market activity levels
✅ Consider comparable scarcity in valuation range width
✅ Document transaction volume context in valuation reports
In low-transaction markets, comparable evidence carries less weight, requiring surveyors to broaden geographic search parameters or extend timeframes—with appropriate adjustments for both factors.
Technique 4: Cross-Regional Validation
For properties in transitional areas or markets showing mixed signals, cross-regional validation provides additional confidence. This involves:
- Analyzing comparable evidence from the subject region
- Examining adjacent regional market trends
- Comparing relative performance to national benchmarks
- Identifying local factors driving divergence from regional patterns
For example, properties in Woodford or Loughton might show different patterns than central London despite geographic proximity, requiring nuanced analysis that considers commuter patterns, local employment, and demographic factors.
Practical Application: Regional Case Studies and Adjustment Protocols
Understanding Valuation Methodology for Flat Headline Prices: Surveyor Techniques When Market Momentum Masks Regional Divergence requires examining practical applications across different regional contexts.
Case Study: London Property Valuation (High Downward Pressure)
Scenario: Victorian terrace in Notting Hill, comparable sales from 4-8 months ago averaging £1,850,000.
Adjustment Protocol:
- Time adjustment: Apply -2% per month for sales older than 3 months (reflecting -40% net balance)
- Market sentiment discount: Additional -3% for forward-looking weakness (+7% twelve-month expectation vs. +56% previous)
- Comparable weighting: Prioritize most recent sales at 70% weight, older sales at 30%
- Final valuation range: £1,702,500 – £1,757,000 (8-10% below comparable average)
Documentation requirements:
- Explicit statement of regional market conditions
- Reference to RICS survey data supporting adjustments
- Clear explanation of time adjustment methodology
- Forward-looking market commentary
This approach protects clients from overpaying in a declining market while maintaining professional valuation standards. Understanding how RICS surveys help negotiate property prices becomes particularly valuable in such contexts.
Case Study: Scotland Property Valuation (Positive Growth)
Scenario: Modern detached house in Edinburgh suburbs, comparable sales from 3-6 months ago averaging £425,000.
Adjustment Protocol:
- Time adjustment: Apply +0.5% per month for sales older than 2 months (reflecting positive net balance)
- Market sentiment premium: Additional +1.5% for sustained positive outlook
- Comparable weighting: Even weighting across timeframe given market stability
- Final valuation range: £433,000 – £441,000 (2-4% above comparable average)
Documentation requirements:
- Regional market strength context
- Supply constraint analysis
- Comparative performance vs. national trends
- Buyer demand indicators
Case Study: Transitional Market Valuation (North West)
Scenario: Semi-detached property in Greater Manchester, comparable sales from 2-5 months ago averaging £285,000.
Adjustment Protocol:
- Time adjustment: Apply +0.3% per month (reflecting moderated positive momentum)
- Market sentiment modifier: Neutral (momentum stabilizing from +43% to modest positive)
- Comparable weighting: Recent sales 60%, older sales 40%
- Final valuation range: £285,000 – £293,000 (0-3% range reflecting uncertainty)
Documentation requirements:
- Momentum shift analysis
- Month-to-month trend comparison
- Local sub-market factors
- Forward-looking risk assessment
Adjustment Protocol Summary Table
| Regional Context | Time Adjustment | Sentiment Modifier | Comparable Timeframe | Valuation Range Width |
|---|---|---|---|---|
| London/South East | -1.5% to -2.5% per month | -2% to -4% | 3 months maximum | 3-5% |
| East Anglia | -1% to -2% per month | -1% to -3% | 4 months maximum | 3-4% |
| Scotland/N. Ireland | +0.5% to +1% per month | +1% to +2% | 6 months acceptable | 2-3% |
| North West | +0.3% to +0.5% per month | Neutral to +1% | 5 months | 3-4% |
| Transitional Markets | Variable by sub-market | -1% to +1% | 4-5 months | 4-6% |
Integration with Survey Types
The valuation methodology must integrate with the type of survey being conducted. A homebuyer survey versus full structural survey may require different levels of valuation detail and adjustment documentation.
For properties where offers have been accepted, surveyors must clearly communicate regional market dynamics that may affect the agreed price, potentially supporting price negotiations based on survey findings.
Advanced Considerations: Market Momentum and Forward Indicators
Beyond basic regional adjustments, sophisticated Valuation Methodology for Flat Headline Prices: Surveyor Techniques When Market Momentum Masks Regional Divergence incorporates forward-looking indicators that traditional comparable analysis overlooks.
Momentum Shift Detection
The moderation in North West momentum from +43% to modest positive[3] exemplifies why surveyors must monitor rate of change rather than absolute values. A market transitioning from strong growth to stability requires different valuation treatment than one maintaining steady growth.
Key momentum indicators to monitor:
📈 Month-to-month net balance changes (acceleration or deceleration)
📈 Twelve-month expectation trends (improving or deteriorating)
📈 New instruction supply changes (increasing or decreasing inventory)
📈 Buyer demand indicators (enquiry levels, viewing-to-offer ratios)
📈 Transaction completion rates (fall-through frequency)
Interest Rate Sensitivity Analysis
Buyer demand declining amid interest rate concerns[3] creates valuation pressures particularly acute in capital appreciation-sensitive markets[1]. Surveyors should assess property-specific interest rate sensitivity:
High sensitivity properties:
- Premium London locations dependent on international buyers
- Properties at upper price brackets requiring large mortgages
- Investment properties where yield calculations are rate-dependent
- New-build developments with Help to Buy exposure
Lower sensitivity properties:
- Cash buyer-dominated markets (retirement locations, downsizer properties)
- Properties in strong rental markets with yield support
- Affordable housing segments with structural demand
- Areas with strong local employment and wage growth
This sensitivity analysis informs adjustment magnitude and valuation range width.
Supply-Demand Balance Assessment
While new instruction supply remains stable nationally at +2% net balance[3], regional variations in supply-demand dynamics critically affect valuation methodology. Markets with supply constraints justify more confident valuations and narrower ranges, while oversupplied markets require conservative approaches.
Supply constraint indicators:
- Time on market declining
- Multiple offer scenarios increasing
- New instruction absorption rates
- Stock-to-sales ratios
Oversupply indicators:
- Extended marketing periods
- Price reduction frequency
- Vendor concession prevalence
- Inventory accumulation
Documentation Standards for Divergent Markets
Professional valuation reports in divergent markets require enhanced documentation that explicitly addresses:
- Regional market context with specific reference to RICS survey data
- Adjustment methodology explanation including time adjustments and sentiment modifiers
- Comparable selection rationale with weighting justification
- Forward-looking commentary on market expectations and risks
- Valuation range explanation with confidence level discussion
- Alternative scenarios if market conditions shift
This documentation protects both surveyor and client by creating transparent, defensible valuation conclusions that acknowledge market complexity.
Conclusion
The Valuation Methodology for Flat Headline Prices: Surveyor Techniques When Market Momentum Masks Regional Divergence represents essential professional knowledge for property surveyors operating in 2026's complex market environment. When national headlines show flat prices at -12% net balance, the reality spans from London's -40% downward pressure to Scotland's continued growth—a divergence requiring sophisticated, region-specific valuation approaches.
Successful surveyors must abandon reliance on national indices and implement localized comparable selection with regional weighting, sentiment-adjusted valuation ranges, transaction volume analysis, and cross-regional validation techniques. The dramatic collapse in London's twelve-month expectations from +56% to +7% demonstrates why forward-looking indicators must complement backward-looking comparable evidence.
Actionable Next Steps
✅ Review your current valuation methodology to ensure regional market dynamics are explicitly incorporated
✅ Establish monthly RICS survey data monitoring to track regional net balances and sentiment shifts
✅ Implement sentiment-adjusted valuation ranges rather than point valuations in volatile markets
✅ Document regional context thoroughly in all valuation reports to support adjustment decisions
✅ Develop region-specific time adjustment protocols based on local market momentum
✅ Engage with local market intelligence from estate agents, mortgage brokers, and transaction data
✅ Consider professional development in advanced valuation techniques for divergent markets
For property buyers and sellers navigating these complex regional markets, engaging qualified property surveyors who understand these sophisticated valuation methodologies becomes critical. Whether in Tottenham, Lewisham, or any other London borough, accurate valuation requires expertise that goes far beyond simple comparable analysis.
The flat headline price environment of 2026 presents both challenges and opportunities. Surveyors who master regional divergence techniques will provide superior client value, maintain professional standards, and navigate market complexity with confidence. As regional patterns continue evolving, the ability to adjust valuation methodology dynamically—rather than applying static formulas—separates exceptional surveyors from the merely competent.
References
[1] Valuation Methodology For Flat And Declining Markets Surveyor Techniques When Regional Price Pressures Mount – https://nottinghillsurveyors.com/blog/valuation-methodology-for-flat-and-declining-markets-surveyor-techniques-when-regional-price-pressures-mount
[2] Valuation Impacts Of February 2026 Rics Survey Strategies For Regional Price Divergence In Uk Markets – https://nottinghillsurveyors.com/blog/valuation-impacts-of-february-2026-rics-survey-strategies-for-regional-price-divergence-in-uk-markets
[3] Uk Residential Market Survey February 2026 – https://www.rics.org/content/dam/ricsglobal/documents/market-surveys/uk-residential-market-survey/UK-Residential-Market-Survey_February-2026.pdf