
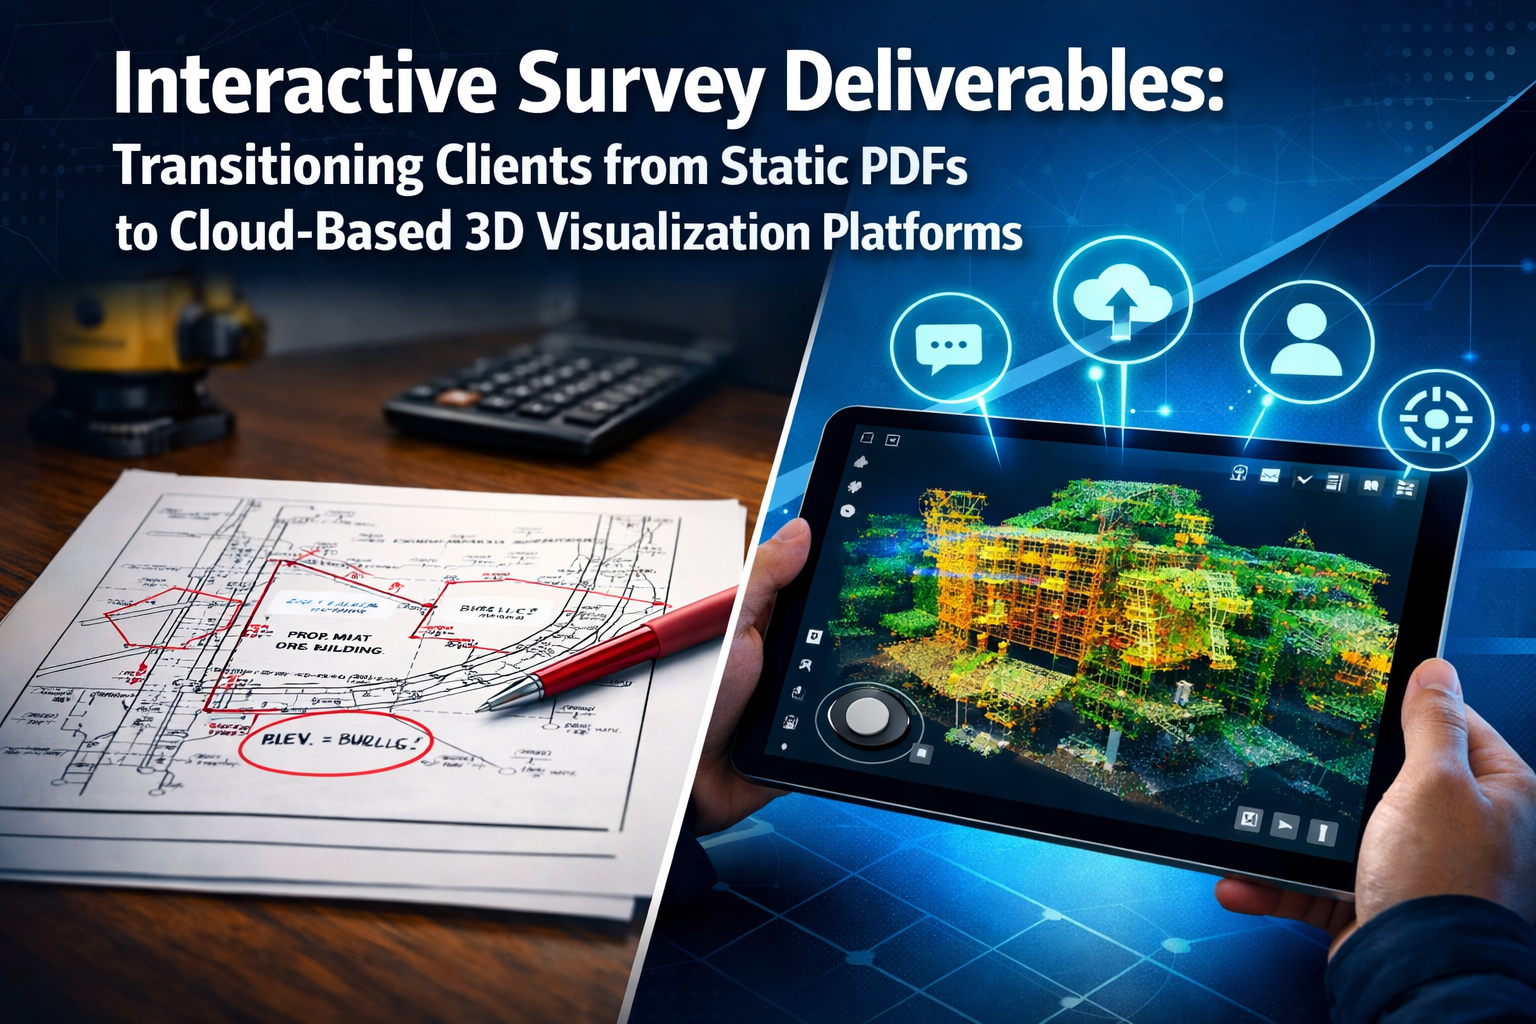
The surveying industry stands at a pivotal crossroads in 2026. While traditional static PDF reports have served the profession for decades, clients increasingly demand more—they want to explore, interact, and collaborate with survey data in real-time. The transition from paper-based deliverables to Interactive Survey Deliverables: Transitioning Clients from Static PDFs to Cloud-Based 3D Visualization Platforms represents not just a technological upgrade, but a fundamental shift in how surveying professionals deliver value and differentiate themselves in a competitive marketplace.
Imagine a client receiving a survey report that allows them to rotate a 3D building model, measure distances themselves, track construction progress over time, and share specific findings with their architect—all from a simple web link, no specialized software required. This is the promise of cloud-based 3D visualization platforms, and forward-thinking surveyors are already reaping the benefits through improved client satisfaction, reduced revision cycles, and stronger competitive positioning.
Key Takeaways
✅ Cloud-based platforms eliminate software barriers by enabling clients to access 3D models, point clouds, and survey data directly through web browsers without specialized CAD or GIS installations
✅ Real-time collaboration features allow architects, engineers, and stakeholders to annotate, measure, and discuss survey findings simultaneously, reducing project delays and miscommunication
✅ Multiple export formats (DXF, SHP, PLY, OBJ, TIFF) ensure seamless integration with existing client workflows while maintaining cloud-based accessibility as the primary delivery method
✅ Emerging capture technologies like RTK videogrammetry and professional LiDAR systems make high-quality 3D data collection more accessible and cost-effective for surveying firms of all sizes
✅ Competitive differentiation through interactive deliverables positions surveying firms as technology leaders, justifying premium pricing and improving client retention rates
Understanding the Limitations of Traditional PDF Survey Reports

For generations, surveying professionals have delivered their findings through comprehensive PDF reports containing photographs, diagrams, measurements, and written observations. While these documents serve an important archival purpose, they present significant limitations in today's fast-paced, collaborative construction environment.
The Static Nature Problem
Traditional PDF reports capture a single moment in time with fixed viewpoints and predetermined measurements. When a client wants to check a dimension not included in the original report, they must contact the surveyor for clarification or request a site revisit—creating delays and additional costs.
Consider a typical RICS Building Survey delivered as a PDF. The document might include dozens of photographs and detailed descriptions, but the client cannot:
- Rotate the view to see features from different angles
- Measure distances between points not originally documented
- Compare conditions across multiple site visits
- Annotate specific areas for discussion with contractors
- Share specific sections with team members without forwarding the entire document
Collaboration Bottlenecks
PDF reports create linear communication workflows that slow down decision-making. An architect reviews the survey, emails questions to the client, who forwards them to the surveyor, who responds with clarifications—a process that can take days or weeks for complex projects.
The inability to have simultaneous access to survey data means stakeholders work in isolation rather than collaboratively. When issues arise during construction, teams cannot quickly reference the original survey conditions in an interactive format, leading to disputes and delays.
Version Control Challenges
As projects evolve, survey reports often require updates and revisions. With PDF deliverables, managing multiple versions becomes problematic:
- Clients may reference outdated reports
- Email chains become confused with multiple attachments
- No clear audit trail of what changed between versions
- Risk of working from superseded information
These limitations have become increasingly problematic as construction projects demand faster turnarounds and more sophisticated coordination between disciplines. The solution lies in Interactive Survey Deliverables: Transitioning Clients from Static PDFs to Cloud-Based 3D Visualization Platforms—a transformation that addresses these fundamental weaknesses while adding powerful new capabilities.
The Cloud-Based 3D Visualization Revolution
The surveying industry's digital transformation mirrors broader technological shifts across professional services. Just as architects moved from drafting tables to BIM software, and engineers embraced computational design, surveyors now have access to sophisticated cloud platforms that fundamentally change how they capture, process, and deliver spatial data.
What Cloud-Based 3D Platforms Offer
Modern cloud visualization platforms provide browser-based access to rich 3D survey data without requiring clients to install specialized software. Platforms like 3Dsurvey have integrated cloud-based sharing as a core deliverable feature, allowing clients to access orthophotos, 3D models, point clouds, and CAD data directly through web links[1].
The key capabilities include:
🌐 Universal Accessibility
Clients simply click a link to view survey data on any device—desktop computers, tablets, or smartphones. This "just click and view" approach eliminates the technical barriers that previously prevented stakeholders from engaging directly with survey information[1].
📊 Interactive Measurement Tools
Rather than relying on pre-calculated measurements in a PDF, clients can perform their own measurements within the 3D environment. This self-service capability dramatically reduces follow-up questions and empowers clients to explore the data according to their specific needs.
🎨 Advanced Visualization Options
Cloud platforms support sophisticated presentation methods including choropleth maps, point clusters, heatmaps, 3D extrusions, and time-series animations[2]. These visualization techniques help clients understand complex spatial relationships and changes over time—something impossible with static reports.
👥 Real-Time Collaboration
Multiple stakeholders can access the same 3D model simultaneously, adding annotations, measurements, and comments that are instantly visible to all team members. Tools like Atlas offer team-based spatial data sharing with project organization by location and date[2], creating a centralized hub for project communication.
Industry Adoption and Platform Maturity
The professional surveying sector has embraced cloud-based workflows at an accelerating pace. 3Dsurvey reports over 70 partners worldwide as of 2026[1], indicating significant adoption among surveying firms seeking competitive advantages through technology.
Platform pricing has also become more accessible, democratizing advanced visualization capabilities. Atlas offers a free tier with Pro plans starting at $29/month[2], making cloud-based delivery feasible even for smaller surveying practices.
For property surveyors conducting condition surveys, the ability to deliver interactive 3D documentation alongside traditional reports provides clients with unprecedented insight into building conditions. Rather than interpreting written descriptions of structural issues, clients can explore the actual 3D geometry and see problems in spatial context.
Format Compatibility and Workflow Integration
A critical concern for surveyors considering cloud platforms is compatibility with existing client workflows. Modern platforms address this through comprehensive export capabilities. 3Dsurvey supports export to industry-standard formats including DXF, SHP, PDF, XYZ, TIFF, PLY, and OBJ[1], ensuring CAD and GIS system compatibility.
This hybrid approach—cloud-based primary delivery with downloadable traditional formats—provides the best of both worlds. Clients get interactive visualization for collaboration and exploration, while still receiving compatible files for their established design and documentation workflows.
Step-by-Step Implementation Guide for Surveying Firms
Transitioning to Interactive Survey Deliverables: Transitioning Clients from Static PDFs to Cloud-Based 3D Visualization Platforms requires careful planning and systematic implementation. This guide provides a practical roadmap for surveying firms ready to modernize their deliverable strategy.
Phase 1: Assessment and Platform Selection (Weeks 1-2)
Evaluate Current Deliverable Workflows
Begin by documenting your existing survey delivery process:
- What formats do you currently provide? (PDF reports, CAD files, photographs)
- How do clients typically use your deliverables?
- What questions or revision requests do you receive most frequently?
- Which project types would benefit most from interactive visualization?
This assessment helps identify pain points that cloud platforms can address and prioritize implementation efforts on high-value project types.
Research Platform Options
Not all cloud visualization platforms serve the same needs. Consider these factors:
| Platform Feature | Questions to Ask |
|---|---|
| Data Types Supported | Does it handle point clouds, photogrammetry models, LiDAR data? |
| Collaboration Tools | Can multiple users annotate and measure simultaneously? |
| Export Capabilities | Does it support formats your clients need (DXF, SHP, IFC)? |
| Pricing Structure | Per-project, subscription, or storage-based pricing? |
| Client Experience | How intuitive is the interface for non-technical users? |
| Mobile Support | Does it work well on tablets and smartphones? |
For firms conducting building surveys and structural assessments, platforms with robust annotation and measurement tools prove most valuable. Property valuation specialists might prioritize platforms offering immersive walkthroughs similar to Matterport's digital twin capabilities[7].
Pilot Project Selection
Choose 2-3 upcoming projects as pilots for cloud-based deliverables:
- Select projects with tech-savvy clients who will appreciate innovation
- Choose medium complexity projects (not your most challenging work initially)
- Pick projects with collaborative requirements involving multiple stakeholders
- Ensure adequate timeline flexibility to accommodate learning curves
Phase 2: Data Capture Optimization (Weeks 3-4)
Upgrade Capture Methodologies
Cloud-based 3D deliverables require appropriate source data. Evaluate your current capture methods:
Traditional Methods:
- Laser scanning produces high-quality point clouds ideal for cloud platforms
- Total station surveys can be supplemented with photogrammetry
- Handheld measurements benefit from photo documentation for 3D context
Emerging Technologies:
RTK Videogrammetry represents an innovative capture method supported by platforms like 3Dsurvey, enabling surveyors to generate thousands of georeferenced 3D frames from smartphone video paired with RTK GNSS[1]. This approach proves particularly useful where drone flights face restrictions or when on-site pilots are unavailable.
For firms offering damp surveys or specialized inspections, combining thermal imaging with 3D photogrammetry creates powerful interactive deliverables that show moisture issues in spatial context.
Invest in Appropriate Equipment
Depending on your service offerings, consider:
- Professional LiDAR cameras like Matterport's Pro3 for immersive property documentation[7]
- Drone systems with RTK capabilities for large-site surveys
- Smartphone rigs with RTK GNSS for flexible videogrammetry capture[1]
- 360-degree cameras for supplementary visual context
The investment should align with your target project types and expected return on investment from improved deliverables.
Phase 3: Processing Workflow Development (Weeks 5-6)
Establish Processing Protocols
Cloud-based deliverables require efficient processing workflows. Platforms like 3Dsurvey include integrated CAD tools that allow surveyors to vectorize and process point clouds directly within the platform[1], reducing the need for separate software tools.
Create standardized workflows for:
-
Data Import and Registration
- Georeferencing procedures
- Quality control checkpoints
- Accuracy verification protocols
-
Model Processing
- Point cloud cleaning and classification
- Mesh generation parameters
- Texture optimization for web viewing
-
Annotation and Documentation
- Standard annotation styles and symbols
- Measurement documentation protocols
- Issue categorization systems
-
Cloud Publishing
- Naming conventions for projects
- Access permission settings
- Sharing link generation procedures
Optimize for Web Performance
Cloud viewers must balance visual quality with loading speed. Best practices include:
- Decimating dense point clouds to appropriate resolutions for web viewing
- Optimizing texture sizes for faster loading
- Creating multiple detail levels (LOD) for progressive loading
- Testing performance on various devices and connection speeds
Phase 4: Client Communication and Training (Weeks 7-8)
Develop Client Education Materials
Create resources that help clients understand and appreciate interactive deliverables:
- Video tutorials (2-3 minutes) showing basic navigation and measurement
- Quick reference guides (one-page PDF) with common tasks
- FAQ documents addressing technical requirements and compatibility
- Case studies demonstrating value through specific examples
Pilot Project Delivery
When delivering your first cloud-based projects:
- Schedule a walkthrough call rather than simply emailing a link
- Demonstrate key features relevant to the specific project
- Show comparison with what a traditional PDF would have provided
- Collect feedback systematically through surveys or interviews
- Document questions to improve future training materials
For clients accustomed to traditional homebuyers reports, the transition to interactive formats may require additional hand-holding. Emphasize the practical benefits—the ability to show contractors specific issues, measure spaces for furniture planning, or share findings with family members involved in the purchase decision.
Phase 5: Refinement and Scaling (Weeks 9-12)
Analyze Pilot Results
Evaluate pilot projects across multiple dimensions:
Client Satisfaction Metrics:
- Survey response rates and satisfaction scores
- Reduction in follow-up questions
- Time to project approval/decision-making
- Willingness to pay premium pricing
Operational Efficiency:
- Processing time compared to traditional deliverables
- Revision request frequency
- Staff training requirements
- Technical support needs
Business Impact:
- Project win rates when showcasing interactive deliverables
- Client retention and referral rates
- Competitive differentiation in proposals
- Revenue per project trends
Expand Service Offerings
Based on pilot learnings, develop tiered service packages:
| Service Tier | Deliverables | Ideal For |
|---|---|---|
| Standard | PDF report + basic 3D viewer link | Residential surveys, simple inspections |
| Professional | Interactive 3D model + measurements + annotations | Commercial properties, renovation projects |
| Premium | Full collaboration platform + progress tracking + multi-visit comparison | Large developments, ongoing monitoring |
This tiered approach allows clients to select appropriate service levels while positioning interactive deliverables as value-added offerings rather than standard expectations.
Phase 6: Advanced Capabilities Integration (Ongoing)
Surface Comparison and Progress Tracking
Advanced cloud platforms offer surface comparison tools that facilitate construction progress documentation. Using colorization by elevation, slope, or intensity helps clients understand site changes over time[1]—ideal for progress reports and construction inspections.
For surveyors offering ongoing monitoring services, time-series visualization capabilities enable powerful before/after comparisons. Clients can see exactly how sites have evolved across multiple survey visits, with quantified volume changes and surface deviations.
Hybrid 2D/3D Interactivity
Browser-based 3D design platforms like Spline support real-time collaboration with professional material layering, enabling hybrid 2D/3D interactivity when embedded in web deliverables[4]. This allows surveyors to create custom interactive presentations that combine traditional plan views with 3D exploration.
Integration with Client Systems
For repeat clients with established BIM or GIS workflows, explore deeper integrations:
- API connections for automated data transfer
- Custom viewer embedding within client project management systems
- Automated reporting that pulls measurements from cloud models
- Webhook notifications when new survey data is published
These advanced integrations position your firm as a strategic technology partner rather than a simple service provider.
Overcoming Common Implementation Challenges

While the benefits of Interactive Survey Deliverables: Transitioning Clients from Static PDFs to Cloud-Based 3D Visualization Platforms are substantial, surveying firms commonly encounter specific challenges during implementation. Understanding these obstacles and their solutions accelerates successful adoption.
Challenge 1: Client Resistance to Change
The Problem:
Long-standing clients may resist new deliverable formats, preferring familiar PDF reports they've used for years. Some may perceive interactive platforms as unnecessary complexity or question whether they'll have the technical skills to use them effectively.
The Solution:
Maintain Hybrid Delivery Initially
Continue providing traditional PDF reports alongside interactive 3D viewers during the transition period. This approach reduces client anxiety while demonstrating the added value of interactive formats.
Emphasize Practical Benefits
Frame the transition around solving specific client pain points:
- "Remember when you needed that additional measurement last month? With the 3D viewer, you can measure anything yourself instantly."
- "Your contractor can now see exactly where the damp issue is located without interpreting written descriptions."
Provide White-Glove Onboarding
For valuable clients, offer personalized training sessions. A 15-minute screen-share demonstration often converts skeptics into enthusiastic advocates.
Challenge 2: Data Processing Bottlenecks
The Problem:
Creating high-quality 3D models from survey data can be time-consuming, potentially extending project delivery timelines and reducing profitability if not managed efficiently.
The Solution:
Invest in Processing Automation
Modern photogrammetry software offers batch processing capabilities. 3Dsurvey's integrated CAD tools allow direct point cloud processing within the platform[1], eliminating time-consuming software switching.
Standardize Capture Protocols
Consistent data capture methods enable templated processing workflows. Create standard operating procedures for each project type that optimize the balance between data quality and processing efficiency.
Consider Processing Hardware Upgrades
High-performance workstations with powerful GPUs dramatically reduce processing times. Calculate ROI based on staff time savings and increased project capacity.
Outsource When Appropriate
For specialized projects or during capacity constraints, consider outsourcing 3D model processing to specialized service providers while maintaining client relationships and final quality control.
Challenge 3: Internet Connectivity and File Size Issues
The Problem:
Large 3D models can be slow to load, particularly for clients with limited internet bandwidth. Poor performance undermines the user experience and may discourage adoption.
The Solution:
Optimize Model Resolution
Create web-optimized versions of 3D models with appropriate polygon counts and texture resolutions. Most cloud platforms offer automatic optimization, but manual refinement often improves results.
Implement Progressive Loading
Use platforms that support level-of-detail (LOD) streaming, where low-resolution models load first, then progressively refine as bandwidth allows.
Provide Offline Options
For critical projects or clients in areas with poor connectivity, offer downloadable lightweight viewers that work without internet connections.
Set Realistic Expectations
Communicate approximate loading times and minimum bandwidth requirements during client onboarding to prevent frustration.
Challenge 4: Data Security and Confidentiality Concerns
The Problem:
Clients may worry about sensitive survey data being stored on third-party cloud servers, particularly for high-security facilities, government projects, or commercially sensitive developments.
The Solution:
Choose Platforms with Robust Security
Select cloud providers offering:
- End-to-end encryption for data transmission and storage
- Compliance with relevant standards (ISO 27001, SOC 2)
- Granular access controls and expiring share links
- Data residency options for jurisdiction-specific requirements
Implement Access Controls
Use password-protected sharing links with expiration dates. Limit access to specific email addresses for sensitive projects.
Offer On-Premises Alternatives
For highest-security projects, maintain capability to deliver 3D models via encrypted USB drives with standalone viewer software rather than cloud hosting.
Document Security Protocols
Create a security white paper explaining your data handling procedures, encryption methods, and compliance certifications. This documentation addresses client concerns proactively.
Challenge 5: Pricing and Value Communication
The Problem:
Determining appropriate pricing for interactive deliverables and communicating their value to justify potential premium pricing can be challenging, particularly when competitors still offer traditional reports at lower prices.
The Solution:
Quantify Time Savings
Calculate the value of reduced revision cycles, fewer clarification calls, and faster decision-making. Present this as ROI for the client:
- "Traditional surveys typically generate 5-7 follow-up measurement requests, each taking 2-3 days to resolve. Interactive deliverables eliminate these delays, potentially saving 2-3 weeks on your project timeline."
Tiered Pricing Models
Offer interactive deliverables as optional upgrades or premium service tiers rather than replacing standard services immediately. This allows market testing and gradual client education.
Bundle with Related Services
Include interactive deliverables as part of comprehensive service packages for ongoing clients. For example, professional surveyor services might include quarterly progress monitoring with cumulative 3D visualization showing changes over time.
Competitive Differentiation
Position interactive deliverables as a key differentiator in proposals. When competing on value rather than price alone, advanced deliverables justify premium positioning and attract quality-focused clients.
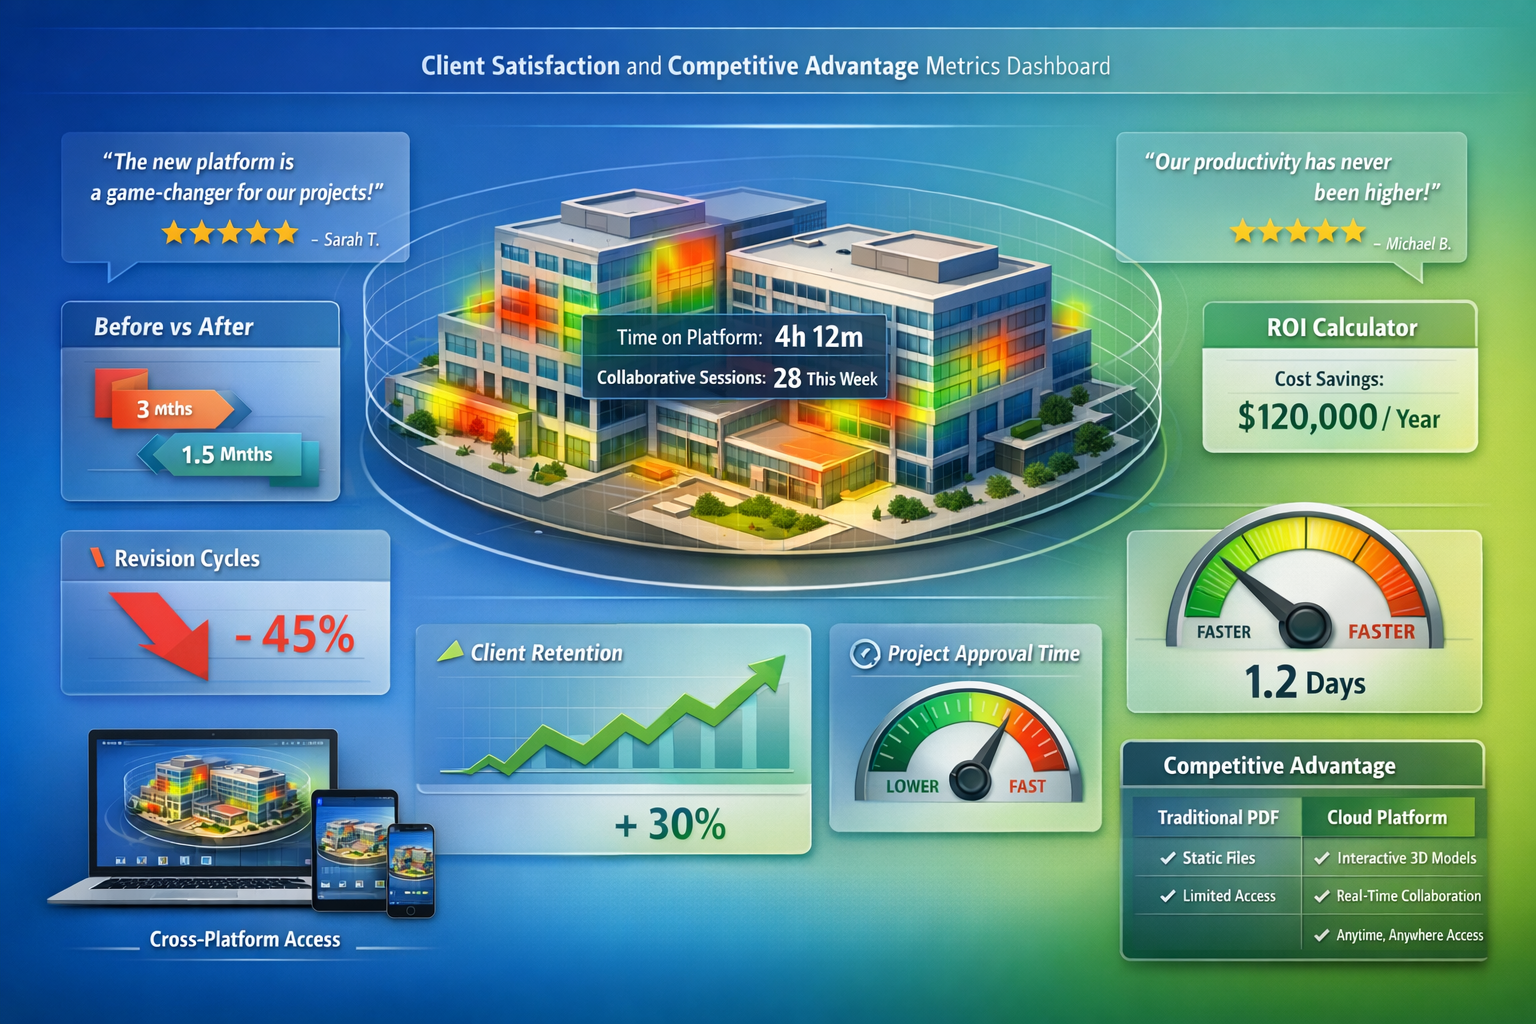
Maximizing Client Satisfaction and Competitive Advantage
Successfully implementing Interactive Survey Deliverables: Transitioning Clients from Static PDFs to Cloud-Based 3D Visualization Platforms extends beyond technical capability—it requires strategic positioning and continuous optimization to maximize business impact.
Building a Client-Centric Delivery Experience
Customized Viewer Interfaces
Many cloud platforms allow branding customization. Configure viewers with:
- Your firm's logo and color scheme
- Custom welcome messages explaining navigation
- Project-specific information panels
- Direct contact links for questions
This professional presentation reinforces your brand and makes clients feel they're receiving premium service.
Contextual Annotations and Guidance
Rather than expecting clients to explore 3D models blindly, provide guided experiences:
- Pre-placed annotations highlighting key findings
- Numbered tours walking through important areas systematically
- Color-coded issue severity (green/amber/red) for quick assessment
- Embedded photos at specific locations providing additional context
For damp surveys in London, annotations might link moisture readings to specific wall locations in the 3D model, with embedded thermal images and recommended remediation approaches.
Multi-Format Deliverable Packages
Create comprehensive deliverable packages that serve different stakeholder needs:
- Executive Summary PDF – High-level findings for decision-makers
- Interactive 3D Viewer – Detailed exploration for technical teams
- Measurement Data Export – CAD files for architects and engineers
- Photo Gallery – Organized images for documentation
- Video Walkthrough – Narrated tour for stakeholders unable to use interactive tools
This multi-format approach ensures accessibility while showcasing your comprehensive service offering.
Leveraging Interactive Deliverables for Business Development
Proposal Differentiation
Include interactive 3D samples in proposals and presentations:
- Showcase previous projects with anonymized client data
- Demonstrate specific capabilities relevant to the prospect's needs
- Provide tablet-based demonstrations during in-person meetings
- Share time-lapse visualizations of construction progress monitoring
When competing for building survey projects, the ability to show rather than describe your deliverable quality provides significant competitive advantage.
Case Study Development
Document success stories quantifying the impact of interactive deliverables:
Example Case Study Structure:
- Client Challenge: Complex renovation requiring coordination between multiple contractors
- Traditional Approach Limitations: PDF reports led to measurement disputes and delays
- Interactive Solution: Cloud-based 3D model with collaborative annotation
- Quantified Results: 40% reduction in clarification requests, 3-week timeline improvement, 15% cost savings through early issue identification
Share these case studies on your website, in proposals, and through professional networks to establish thought leadership.
Continuous Improvement Through Analytics
Track Engagement Metrics
Many cloud platforms provide analytics on how clients interact with 3D models:
- Time spent viewing
- Features most frequently used
- Areas of the model receiving most attention
- Measurements performed
Analyze these metrics to:
- Identify which features clients value most
- Optimize future deliverable organization
- Understand client priorities and concerns
- Improve training materials based on actual usage patterns
Systematic Feedback Collection
Implement structured feedback processes:
Post-Delivery Survey (1 week after delivery):
- How easy was the 3D viewer to use? (1-10 scale)
- Which features did you find most valuable?
- What additional capabilities would be helpful?
- How does this compare to traditional survey reports?
Project Completion Interview (at project end):
- How did interactive deliverables impact project outcomes?
- Would you request this format for future projects?
- What would you change about the experience?
This feedback drives continuous improvement and provides testimonials for marketing purposes.
Expanding Service Offerings
Progress Monitoring and Time-Series Analysis
Interactive platforms enable new service models beyond one-time surveys:
Monthly Progress Documentation:
- Regular site captures creating cumulative 3D timeline
- Automated change detection highlighting new construction
- Volume calculations tracking earthwork progress
- Deviation analysis comparing as-built to design models
For construction projects, this ongoing monitoring service generates recurring revenue while providing exceptional client value through visual progress documentation.
Collaborative Design Support
Position your firm as a collaborative partner in design processes:
- Provide as-built 3D models for renovation planning
- Support architect coordination through shared annotation platforms
- Offer site analysis visualization for development feasibility studies
- Enable virtual site visits for remote stakeholders
These value-added services leverage your interactive platform capabilities while deepening client relationships.
Training and Team Development
Staff Skill Development
Successful implementation requires team-wide capability:
Technical Skills:
- 3D data capture techniques
- Photogrammetry and point cloud processing
- Cloud platform administration
- Quality control procedures
Client-Facing Skills:
- Explaining technical capabilities to non-technical audiences
- Conducting effective platform demonstrations
- Troubleshooting client access issues
- Gathering and incorporating feedback
Invest in formal training programs and create internal knowledge-sharing systems where team members document best practices and solutions to common challenges.
Specialist Roles
As your interactive deliverable program matures, consider creating specialist positions:
- 3D Visualization Specialist – Optimizes model quality and presentation
- Client Success Manager – Ensures smooth onboarding and ongoing satisfaction
- Technology Integration Lead – Develops custom workflows and platform integrations
These specialized roles enable excellence at scale as interactive deliverables become standard practice.
Future Trends and Emerging Technologies
The evolution of Interactive Survey Deliverables: Transitioning Clients from Static PDFs to Cloud-Based 3D Visualization Platforms continues to accelerate. Understanding emerging trends helps surveying firms stay ahead of the curve and position themselves for long-term competitive advantage.
Artificial Intelligence and Automated Analysis
AI-Powered Feature Detection
Machine learning algorithms increasingly automate the identification and classification of features within 3D survey data:
- Automatic detection of structural defects
- Classification of building components
- Identification of code violations or safety hazards
- Predictive maintenance recommendations based on condition assessment
These AI capabilities enhance deliverable value by providing insights beyond raw spatial data, positioning surveyors as strategic advisors rather than data collectors.
Natural Language Interfaces
Emerging platforms incorporate conversational AI allowing clients to query survey data using natural language:
- "Show me all areas with moisture readings above 20%"
- "What's the distance between the property boundary and the new extension?"
- "Highlight all structural issues rated as urgent"
This accessibility democratizes survey data usage, enabling non-technical stakeholders to extract value independently.
Augmented and Virtual Reality Integration
AR Site Visualization
Mobile AR applications overlay survey data onto real-world views through smartphone or tablet cameras:
- Visualize underground utilities before excavation
- Compare as-built conditions to design intent
- Show property boundaries and setbacks on-site
- Display historical conditions at current locations
For boundary survey applications, AR visualization helps clients and contractors understand abstract legal boundaries in physical context.
VR Immersive Experiences
Virtual reality headsets provide fully immersive survey data exploration:
- Walk through buildings before they're constructed
- Experience proposed renovations in spatial context
- Conduct virtual site visits from remote locations
- Compare multiple design alternatives side-by-side
While currently niche, VR capabilities may become standard for high-value projects as hardware costs decrease and accessibility improves.
Internet of Things (IoT) Integration
Continuous Monitoring Networks
Survey deliverables increasingly incorporate ongoing sensor data:
- Structural movement monitoring via tilt sensors
- Environmental condition tracking (temperature, humidity)
- Vibration monitoring for sensitive structures
- Settlement detection through precision positioning
Cloud platforms aggregate this continuous data stream with baseline survey information, creating living documents that update automatically rather than requiring periodic re-surveys.
Digital Twin Ecosystems
The concept of digital twins—virtual replicas of physical assets that update in real-time—represents the ultimate evolution of interactive survey deliverables. Surveying firms providing the foundational spatial data for digital twins position themselves at the center of facility management ecosystems.
Blockchain for Data Provenance
Immutable Survey Records
Blockchain technology offers solutions for survey data authentication and chain-of-custody documentation:
- Cryptographic proof of survey date and conditions
- Tamper-evident revision histories
- Verified professional credentials and certifications
- Automated compliance with regulatory requirements
For legally sensitive applications like party wall surveys or boundary disputes, blockchain-verified survey data provides enhanced credibility and legal defensibility.
Democratization Through Mobile Technology
Smartphone-Based Professional Capture
The gap between consumer and professional survey technology continues to narrow. RTK-enabled smartphones paired with specialized apps enable professional-grade data capture at consumer price points[1].
This democratization creates both opportunities and challenges:
Opportunities:
- Lower barriers to entry for new surveying firms
- Expanded service accessibility for smaller projects
- Rapid deployment for emergency response situations
Challenges:
- Increased competition from non-traditional providers
- Pressure on pricing for commodity survey services
- Greater importance of value-added analysis and interpretation
Successful firms will leverage accessible technology while differentiating through expertise, client service, and sophisticated deliverable presentation.
Sustainability and Carbon Footprint Tracking
Environmental Impact Documentation
Survey deliverables increasingly incorporate sustainability metrics:
- Energy performance modeling based on building geometry
- Solar potential analysis from roof surveys
- Green space quantification for urban planning
- Carbon footprint calculations for construction materials
Interactive platforms enable clients to explore sustainability scenarios, comparing environmental impacts of different design or renovation approaches.
Platform Consolidation and Standardization
Industry-Wide Interoperability
As cloud-based survey deliverables mature, industry pressure for standardization increases:
- Common data exchange formats across platforms
- Standardized API specifications for integration
- Unified metadata schemas for survey information
- Cross-platform viewer compatibility
This standardization benefits clients through reduced vendor lock-in while enabling surveyors to select best-of-breed tools for specific applications without compatibility concerns.
The surveying firms that thrive in this evolving landscape will balance technological adoption with fundamental professional values—accuracy, integrity, and client service. Interactive deliverables represent tools that amplify these core competencies rather than replacing them.
Conclusion: Embracing the Future of Survey Deliverables
The transition from static PDF reports to Interactive Survey Deliverables: Transitioning Clients from Static PDFs to Cloud-Based 3D Visualization Platforms represents more than a technological upgrade—it's a fundamental reimagining of how surveying professionals create and deliver value. As we've explored throughout this guide, cloud-based 3D visualization platforms address critical limitations of traditional deliverables while opening new possibilities for client collaboration, business differentiation, and service innovation.
The benefits are clear and quantifiable:
📈 Enhanced client satisfaction through intuitive, self-service access to survey data
⚡ Reduced project timelines by eliminating revision cycles and clarification delays
💼 Competitive differentiation that justifies premium pricing and attracts quality clients
🤝 Improved collaboration enabling real-time coordination between all project stakeholders
🔄 New revenue opportunities through progress monitoring and ongoing documentation services
The implementation roadmap outlined in this guide provides a practical path forward, from initial platform selection through pilot projects and eventual scaling across your entire service offering. By following this systematic approach, surveying firms can manage the transition effectively while minimizing disruption to existing operations.
Actionable Next Steps
For surveying firms ready to modernize their deliverables, begin with these concrete actions:
This Week:
- Assess your current deliverable process and identify the top three client pain points that interactive platforms could address
- Research platform options using the evaluation criteria provided in this guide
- Identify 2-3 pilot projects from your upcoming work that would benefit from interactive deliverables
This Month:
- Select and subscribe to a cloud visualization platform aligned with your service offerings
- Capture and process 3D data for your pilot projects using optimized workflows
- Deliver interactive models to pilot clients with comprehensive onboarding support
- Collect systematic feedback to refine your approach
This Quarter:
- Develop standardized deliverable packages incorporating both traditional and interactive formats
- Create client education materials including video tutorials and quick reference guides
- Update your marketing materials to showcase interactive deliverable capabilities
- Train your entire team on capture, processing, and client support procedures
This Year:
- Expand interactive deliverables to become standard across all appropriate project types
- Develop case studies quantifying the business impact and client benefits
- Explore advanced capabilities like progress monitoring and AI-powered analysis
- Position your firm as a technology leader through thought leadership and industry engagement
The surveying profession stands at a pivotal moment. Clients increasingly expect digital, collaborative, and interactive experiences across all professional services. Firms that embrace this evolution—while maintaining the accuracy, integrity, and expertise that define professional surveying—will thrive in the years ahead.
Those who cling to traditional static deliverables risk commoditization and competitive disadvantage as more innovative firms capture market share through superior client experiences. The technology is mature, accessible, and proven. The question is not whether to transition to interactive survey deliverables, but how quickly you can implement them to maximize competitive advantage.
Whether you're conducting RICS property valuations, comprehensive building surveys, or specialized inspections, interactive 3D visualization platforms enhance your ability to communicate findings, support client decision-making, and demonstrate professional value.
The future of surveying is interactive, collaborative, and cloud-based. The firms that embrace this future today will define industry standards tomorrow. Start your transition now, and position your practice at the forefront of the profession's digital transformation.
References
[1] 3dsurvey Is The Best Photogrammetry Software In 2026 – https://3dsurvey.si/3dsurvey-is-the-best-photogrammetry-software-in-2026/
[2] Best Geospatial Data Visualization Tools In 2026 – https://atlas.co/blog/best-geospatial-data-visualization-tools-in-2026/
[4] Which Tool Wins For Interactive 3d Design In 2026 – https://www.illustration.app/blog/which-tool-wins-for-interactive-3d-design-in-2026
[7] matterport – https://matterport.com